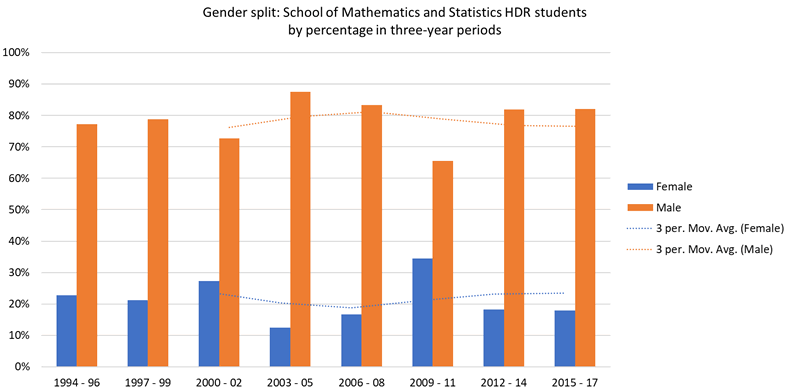
The table below shows the numbers of male and female students who completed higher degrees (research) in the School between 1994 and 2017.
|
Pure Maths Female |
Pure Maths Male |
Applied Maths Female |
Applied Maths Male |
Statistics Female |
Statistics Male |
School total Female |
School total Male |
|
|---|---|---|---|---|---|---|---|---|
| 1994 | 2 | 1 | 2 | 3 | 0 | 1 | 4 | 5 |
| 1995 | 1 | 3 | 0 | 1 | 0 | 0 | 1 | 4 |
| 1996 | 0 | 4 | 0 | 0 | 0 | 4 | 0 | 8 |
| 1997 | 0 | 5 | 1 | 4 | 1 | 2 | 2 | 11 |
| 1998 | 1 | 4 | 1 | 6 | 2 | 0 | 4 | 10 |
| 1999 | 1 | 3 | 0 | 2 | 0 | 0 | 1 | 5 |
| 2000 | 2 | 0 | 0 | 5 | 0 | 1 | 2 | 6 |
| 2001 | 1 | 2 | 2 | 1 | 0 | 1 | 3 | 4 |
| 2002 | 0 | 2 | 0 | 3 | 1 | 1 | 1 | 6 |
| 2003 | 0 | 1 | 0 | 3 | 0 | 0 | 0 | 4 |
| 2004 | 2 | 4 | 0 | 4 | 0 | 1 | 2 | 9 |
| 2005 | 0 | 7 | 0 | 0 | 1 | 1 | 1 | 8 |
| 2006 | 1 | 2 | 0 | 1 | 1 | 0 | 2 | 3 |
| 2007 | 2 | 3 | 0 | 5 | 0 | 1 | 2 | 9 |
| 2008 | 0 | 4 | 0 | 4 | 0 | 0 | 0 | 8 |
| 2009 | 2 | 3 | 2 | 3 | 0 | 1 | 4 | 7 |
| 2010 | 2 | 2 | 1 | 2 | 1 | 0 | 4 | 4 |
| 2011 | 0 | 6 | 1 | 1 | 1 | 1 | 2 | 8 |
| 2012 | 0 | 4 | 1 | 6 | 2 | 1 | 3 | 11 |
| 2013 | 1 | 3 | 0 | 3 | 1 | 1 | 2 | 7 |
| 2014 | 0 | 2 | 0 | 5 | 1 | 2 | 1 | 9 |
| 2015 | 1 | 3 | 0 | 4 | 3 | 3 | 4 | 10 |
| 2016 | 0 | 4 | 0 | 7 | 1 | 3 | 1 | 14 |
| 2017 | 1 | 4 | 0 | 2 | 1 | 2 | 2 | 8 |